This is a continuation of my previous article DAX Chear sheet - Part 1. In this article, I have delved into some of the important Time intelligence functions of DAX. Microsoft's documentation can be found here. I have covered the following DAX expressions:
I have used a mix of Power BI and DAX Studio to demonstrate the custom DAX measures
I will be using the Adventure Works DW 2020 sample model which can be downloaded from Microsoft's site. I have placed a copy of the PBIX in my Github repo, the link to which is here.
To get a feel of what the data looks like I have presented the top 5 rows from each of the tables in this database

Most of the custom DAX measures presented below are written around Sales[Sales Amount] columns. I have also added a new date table MyCalendar
To understand the workings of the Date and Time intelligence DAX functions we will begin with creating a custom Date table. The AdventureWorks model also comes with a date table. This is the table named Date and is linked to the Sales table via the column DateKey.
A date table is like any other table in Power BI but with some mandatory requirements as prescribed by Power BI here
2 reasons. We want to explore this learning opportunity to create a fairly sophisticated date table. And, by not relying on the relationships we can learn how to marry a general purpose Date table to report on any date based data time (Sales Amount in this example)
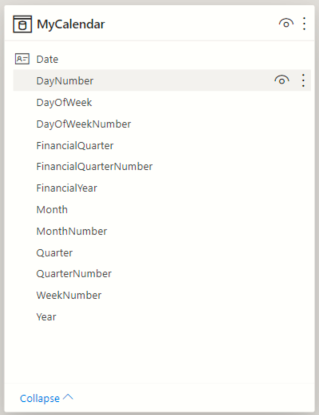
There are two Power BI functions which are useful for creating date tables. These are CALENDAR and CALENDARAUTO I have taken inspiration from this wonderful tutorial to create a custom date table and named it as MyCalendar.
MyCalendar =

VAR myExtendedCalendar = ADDCOLUMNS(
            CALENDAR(DATE(2017,7,1),DATE(2021,6,30)),
            "Year", YEAR([Date]),
            "MonthNumber", MONTH([Date]),
            "DayNumber", DAY([Date]),
            "Month", FORMAT([Date],"mmmm"),
            "DayOfWeek", FORMAT([Date],"ddd"),
            "DayOfWeekNumber", WEEKDAY([Date]),
            "QuarterNumber", QUARTER([Date]),
            "Quarter", FORMAT([Date],"\QQ"),
            "WeekNumber",WEEKNUM([Date])
            )
//Add the Financial year columns
VAR myExtendedCalendarWithFinancialColuns = ADDCOLUMNS(
            myExtendedCalendar,
            "FinancialYear",IF( [MonthNumber]>=7, [Year]+1, [Year] ),
            "FinancialQuarterNumber",IF( [MonthNumber]>=7, [QuarterNumber]-2, [QuarterNumber]+2 )
            )
//Add the Financial Quarter columns
VAR myExtendedCalenderWithQuarterDisplayColumn = ADDCOLUMNS(
            myExtendedCalendarWithFinancialColuns,
            "FinancialQuarter",CONCATENATE("Q",[FinancialQuarterNumber])
            )

return myExtendedCalenderWithQuarterDisplayColumn
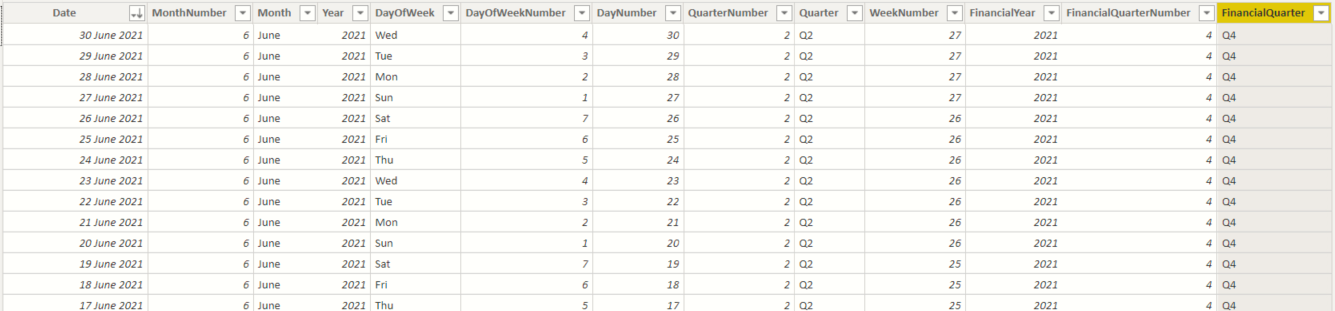
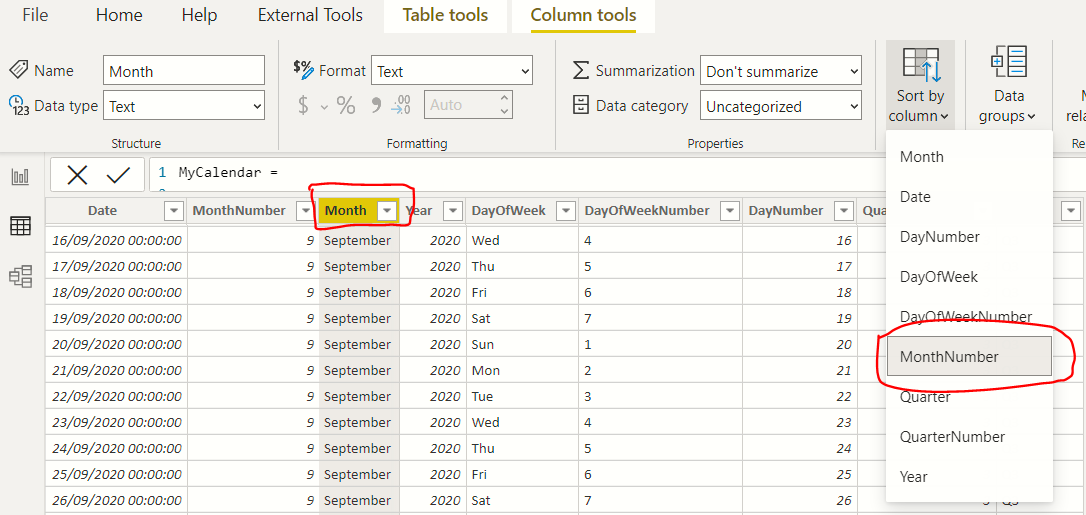
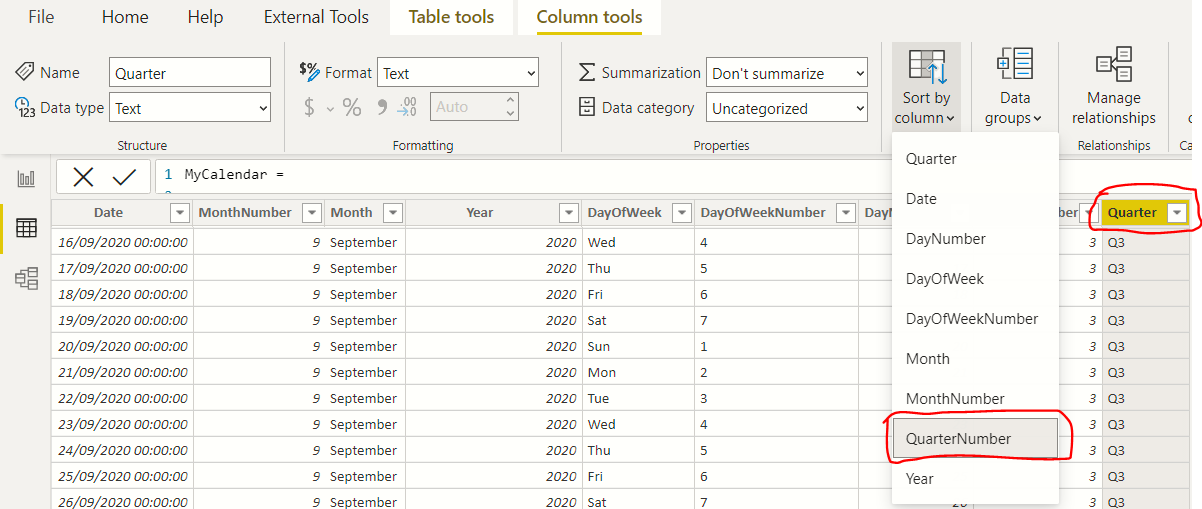
We are nearly there. But, there is one essential step to be carried out. The textual columns like Month, DayOfWeek and Quarter need to be aware of the sort order. Consider the Month column. When this column is selected as the Columns in a Matrix visual, the sort order by default would be alphabetical, i.e. Dec comes before January. This is not right. We want the order Jan, Feb, March, April ,.. Dec. To achieve this we need to specify MonthNumber as the sort column for the Month column
We have completed our ground work. We are now ready to begin our exploration to unerstand the underlying behaviour of the DAX expressions
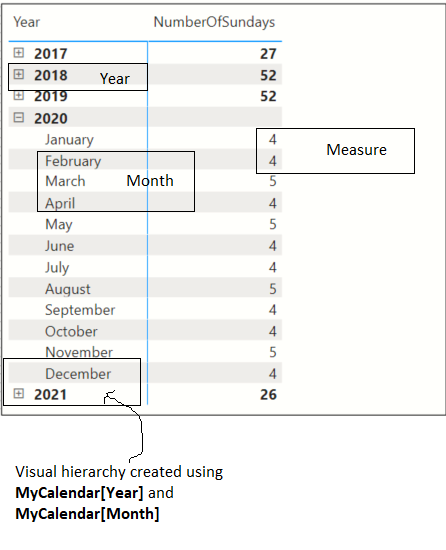
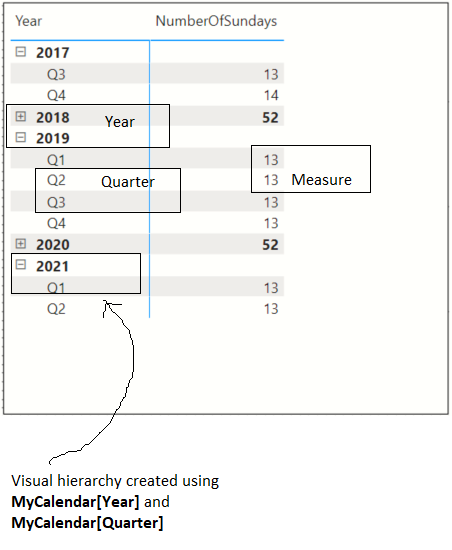
This is a toy scenario. Given any slice of time, how do we find the number of Sundays in that period? In the following examples, a Matrix visual has been used with the Rows divided into hierarhical time periods
NumberOfSundays =
VAR first = FIRSTDATE(MyCalendar[Date])
VAR last = LASTDATE(MyCalendar[Date])
VAR daysInBetween = DATESBETWEEN(MyCalendar[Date] , first, last)
VAR datesWithSundays=FILTER(daysInBetween, WEEKDAY(MyCalendar[Date])==1)
VAR countOfSundays = COUNTROWS(datesWithSundays)
return countOfSundays
For both the examples presented above we have used the single measure NumberOfSundays.
The measure is agnostic of the length of the time period.
The ROW filter in each of the visuals has all the information about the rows from the MyCalendar[Date] table.
We use the expression FIRSTDATE and LASTDATE to find the bounds of the time period in each cell.
The DATESBETWEEN expression gives us a table of all MyCalendar within these bounds.
The count of Sundays is extracted by using the FILTER expression.
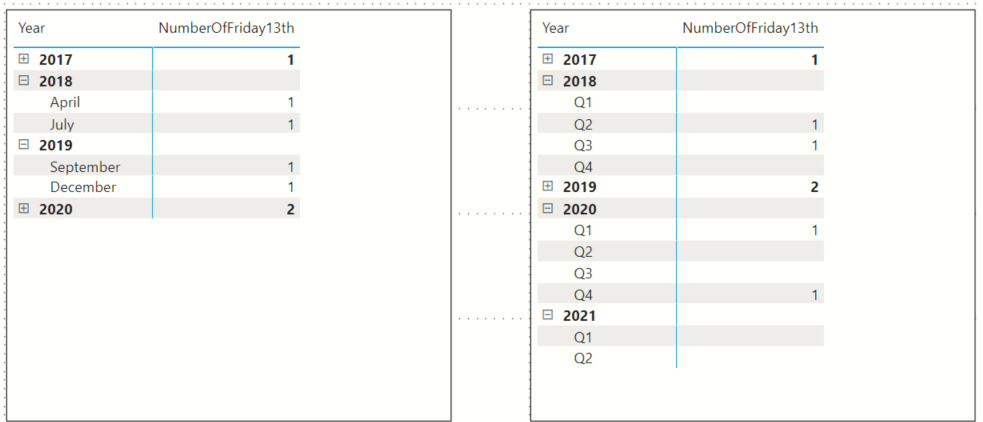
This is a toy scenario. In this example, we count the occurences of all days which are Friday and are the 13 th day of the month. The DAX measure is semantically identical to the one we wrote for counting the Sundays in any time period
NumberOfFriday13th =
VAR first = FIRSTDATE(MyCalendar[Date])
VAR last = LASTDATE(MyCalendar[Date])
VAR between = DATESBETWEEN(MyCalendar[Date],first, last)
VAR days = COUNTROWS
    (
        FILTER(
            between,
            WEEKDAY(MyCalendar[Date])==6 && DAY(MyCalendar[Date])==13
            )
    )
return days
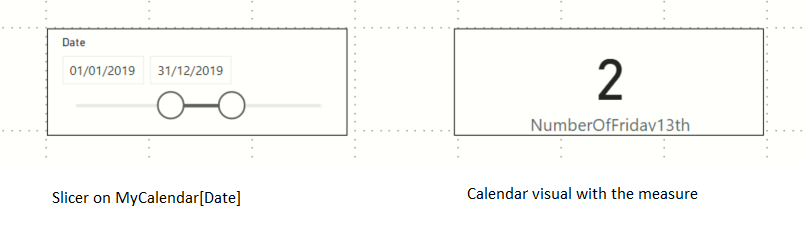
The same DAX measure can now be used to display the count of "Friday the 13th" for any arbitrarily selected time period
Given any any slice of time - calculate the total sales in this period. We will achieve this using 3 different approaches
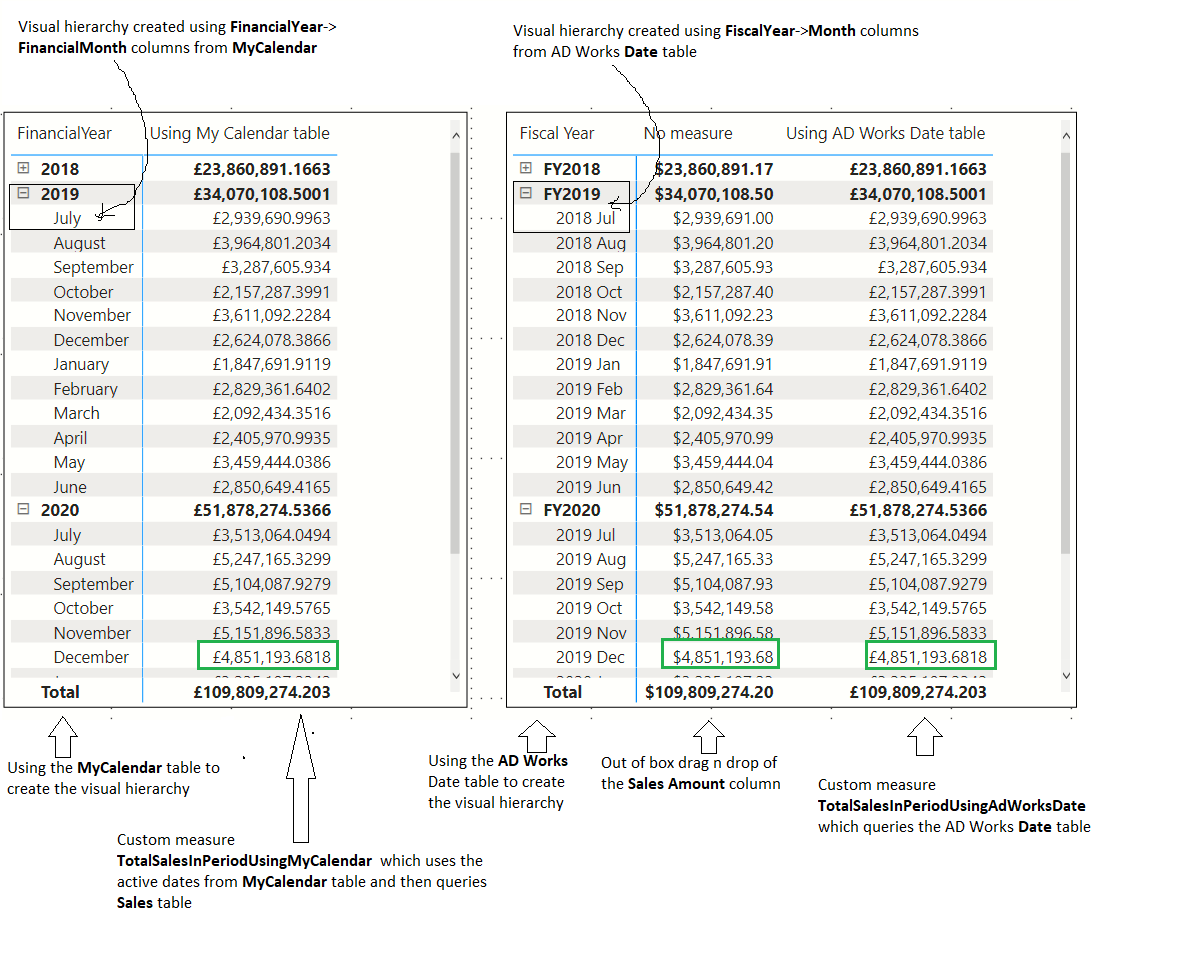
This being a fairly simple calculation, we can drag and drop the Sales Amount column of the Total Sales
and then selecting the Sum option from the context menuThe FIRSTDATE and LASTDATE expressions on the out of box Date table gives us the bounds of the time period in the current context. The DATESBETWEEN gives us all the dates from the date table and we use this to provide a filter in the CALCULATE expression
    TotalSalesInPeriodUsingAdWorksDate =

    var first = FIRSTDATE('Date'[Date])
    var last =  LASTDATE('Date'[Date])

    VAR between = DATESBETWEEN('Date'[Date], first , last)
    VAR filteredDates = FILTER('Date', 'Date'[Date] in between)
    VAR totalSales  = CALCULATE
    (
        SUMX(Sales, Sales[Sales Amount]),
        filteredDates
    )
    return totalSales
The Matrix visual is using the MyCalendar date table to render the hierarchy. Therefore, in this measure we use the FIRSTDATE and LASTDATE to get the bounds. The CALCULATE expression is modifying its context by filtering on the Adventure Works date table
    TotalSalesInPeriodUsingMyCalendar =

    var first = FIRSTDATE(MyCalendar[Date])
    var last =  LASTDATE(MyCalendar[Date])

    /*
    In this measure, we are assuming that there is no direct relationship between MyCalendar and Sales
    Hence the need for explicit filtering
    */
    VAR totalSales  = CALCULATE
    (
        SUMX(Sales, Sales[Sales Amount]),
        FILTER(
            Sales,
            RELATED('Date'[Date]) >= first && RELATED('Date'[Date]) <= last
            )
    )
    return totalSales
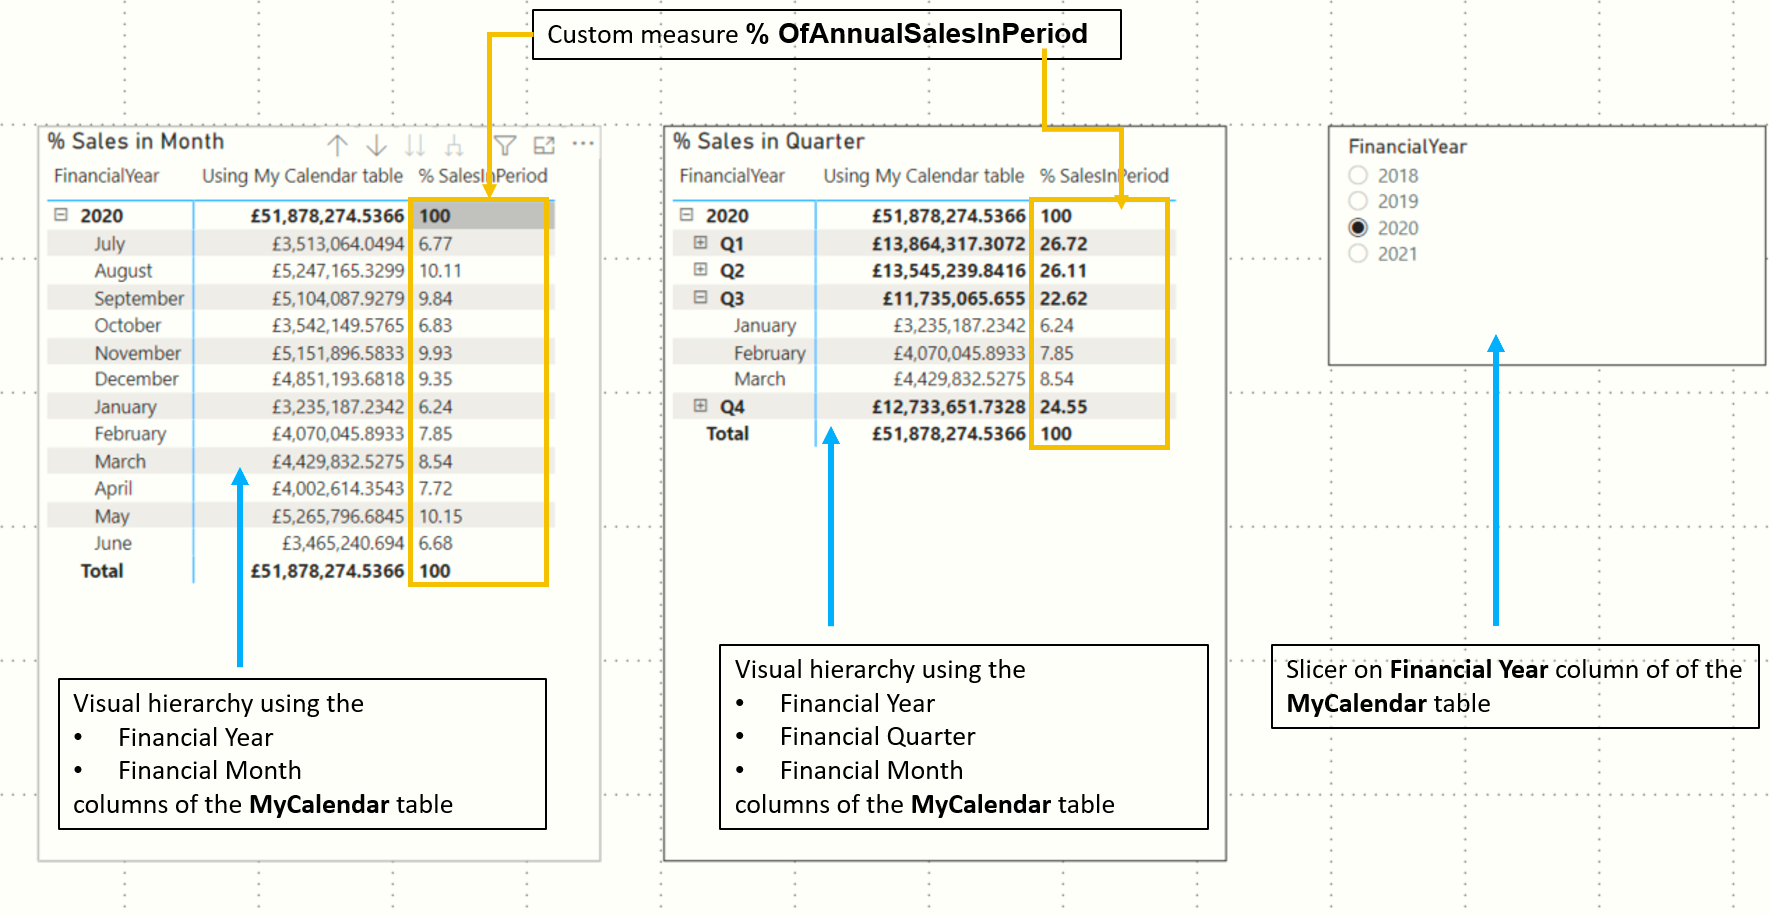
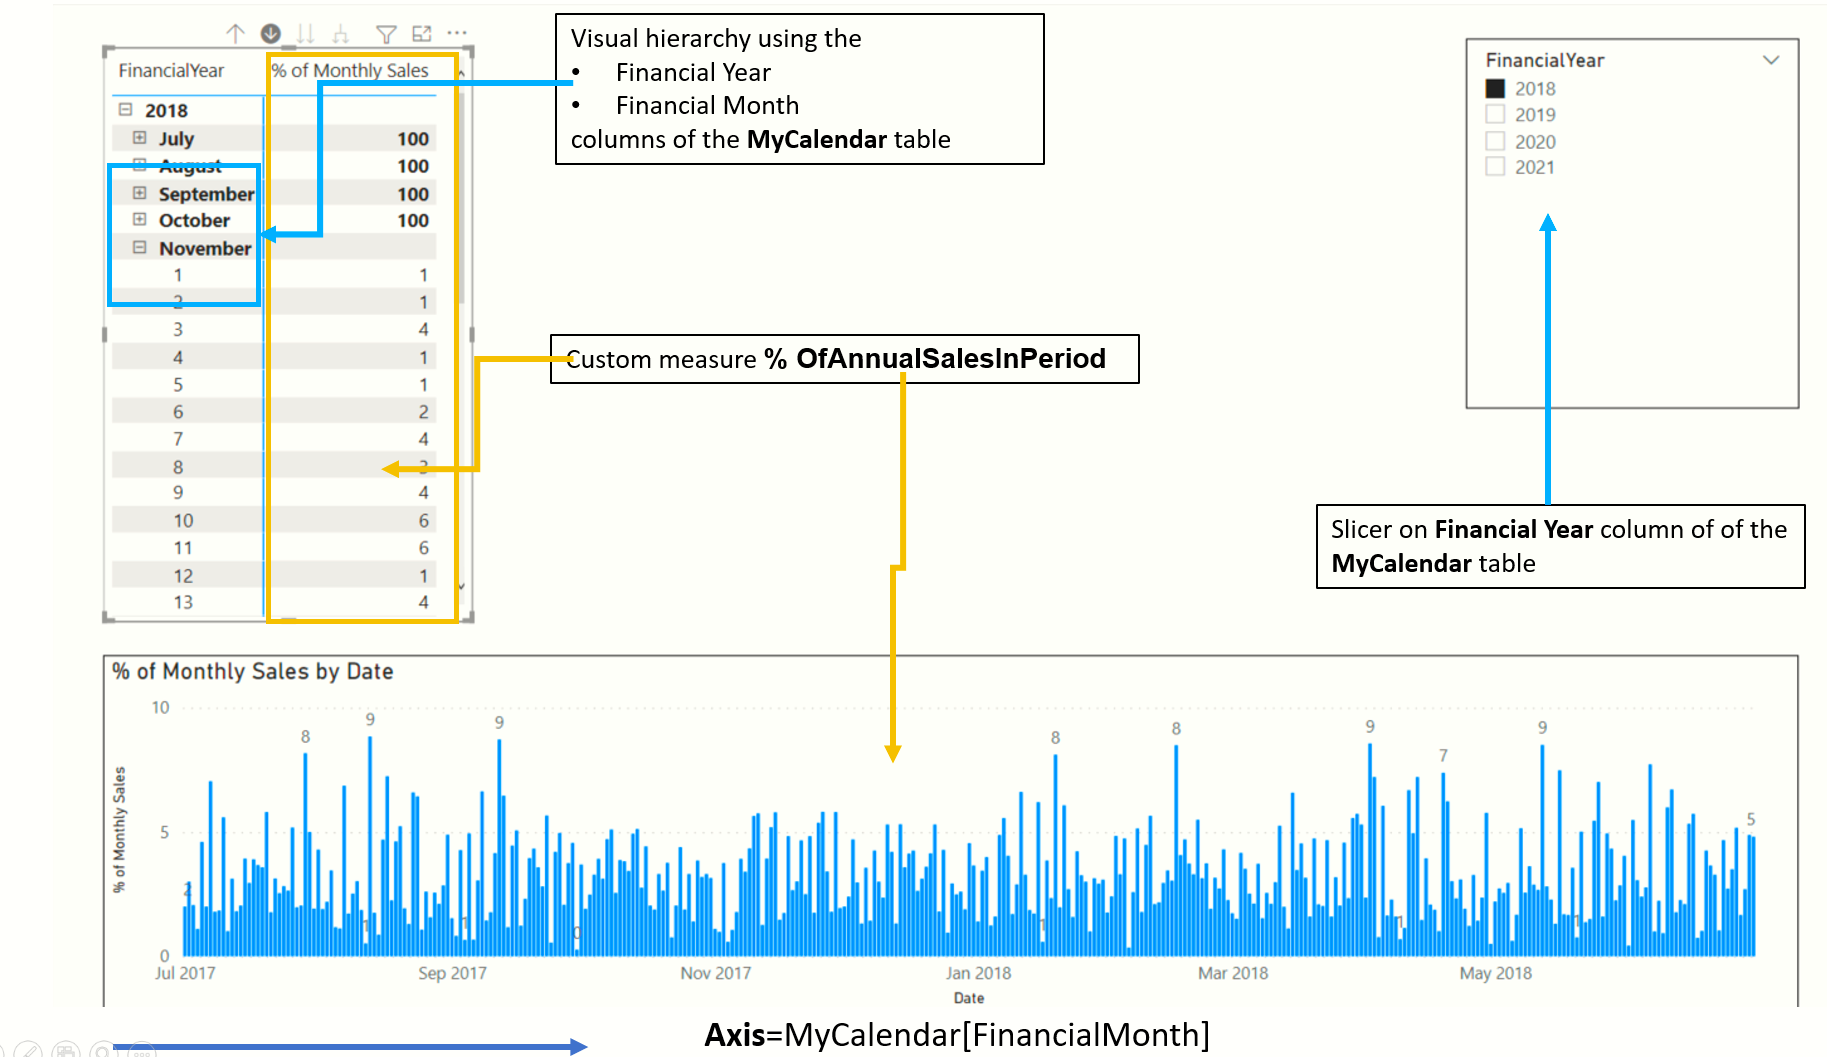
Display the sales in any time period as a percentage of the total annual sales in that financial year. The financial year will be selected using a Slicer on the MyCalendar[Fiancial Year] column
% OfAnnualSalesInPeriod =

    //Step 1 - Calculate total sales in selected financial year
    VAR finYear = SELECTEDVALUE(MyCalendar[FinancialYear])
    VAR allDatesInFinancialYear = FILTER(ALL(MyCalendar), MyCalendar[FinancialYear] == finYear)

    VAR firstDayOfCurrentFinancialYear = CALCULATE( FIRSTDATE(MyCalendar[Date]),allDatesInFinancialYear)
    VAR lastDayOfCurrentFinancialYear = CALCULATE( LASTDATE(MyCalendar[Date]),allDatesInFinancialYear)

    VAR totalSalesInYear  = CALCULATE
    (
        SUMX(Sales, Sales[Sales Amount]),
        FILTER(
            Sales,
            RELATED('Date'[Date]) >= firstDayOfCurrentFinancialYear && RELATED('Date'[Date]) <= lastDayOfCurrentFinancialYear
            )
    )
    //Step 2 - Calculate total sales in the current financial period
    VAR totalSalesInCurrentPeriod = AdventureWorksMeasures[TotalSalesInPeriodUsingMyCalendar]
    VAR roundedValue=ROUND(totalSalesInCurrentPeriod/totalSalesInYear*100.0,2)
    return FORMAT(roundedValue, "General Number") //This is needed to remove the currency symbol because "Sales Amount" has a Currency format
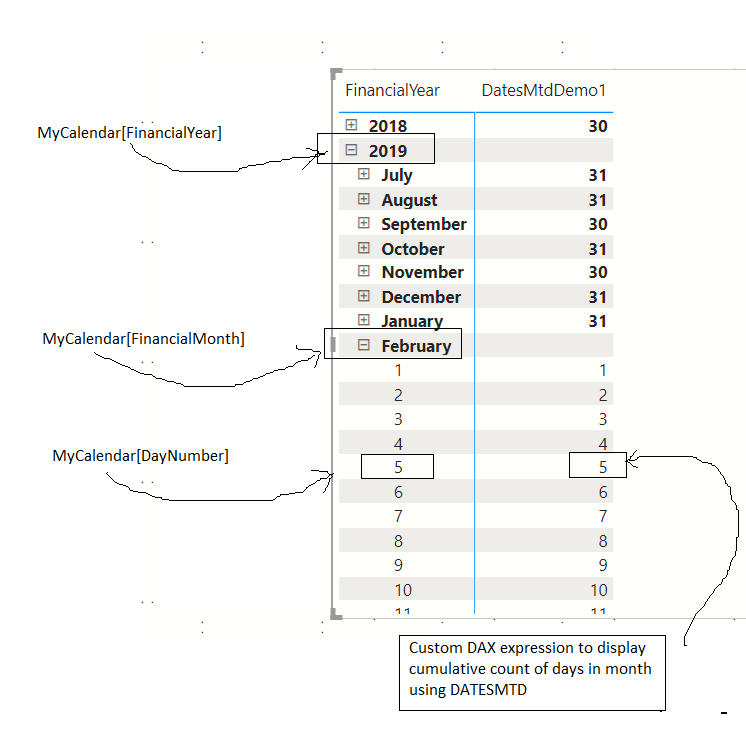
We want to analyze progressive growh of sales from the first day of the specified month right up to the last day in that month. Example: The cumulative sales for June 3rd would be the sum of sales on June 1st and June 2nd. There are couple of ways to achieve this The DAX expression DATESMTD will produce a new table with all dates from the start of the month upto the current day of the context. How is this useful? You can produce a report of running totals (month to date) for any given month. We will proceed cautiously here. Before we jump to calculating the sales we will attempt to get the cumulative dates for any given day in a month. Once this is obtained it is fairly easy to do the next step , i.e. calculate the cumulative sales.
Using the following DAX measure, we display the running total of days from start to current date. E.g. On 4 th February the cumulative count would be 4 (1st Feb, 2nd, 3rd, 4th). Likewise for 5th February, the total would be 5. Why do we need the running total of the days? This will be useful in the next step.
DatesMtdDemo1 =
VAR datesInThisMonth = DATESMTD(MyCalendar[Date])
return COUNTROWS(datesInThisMonth)
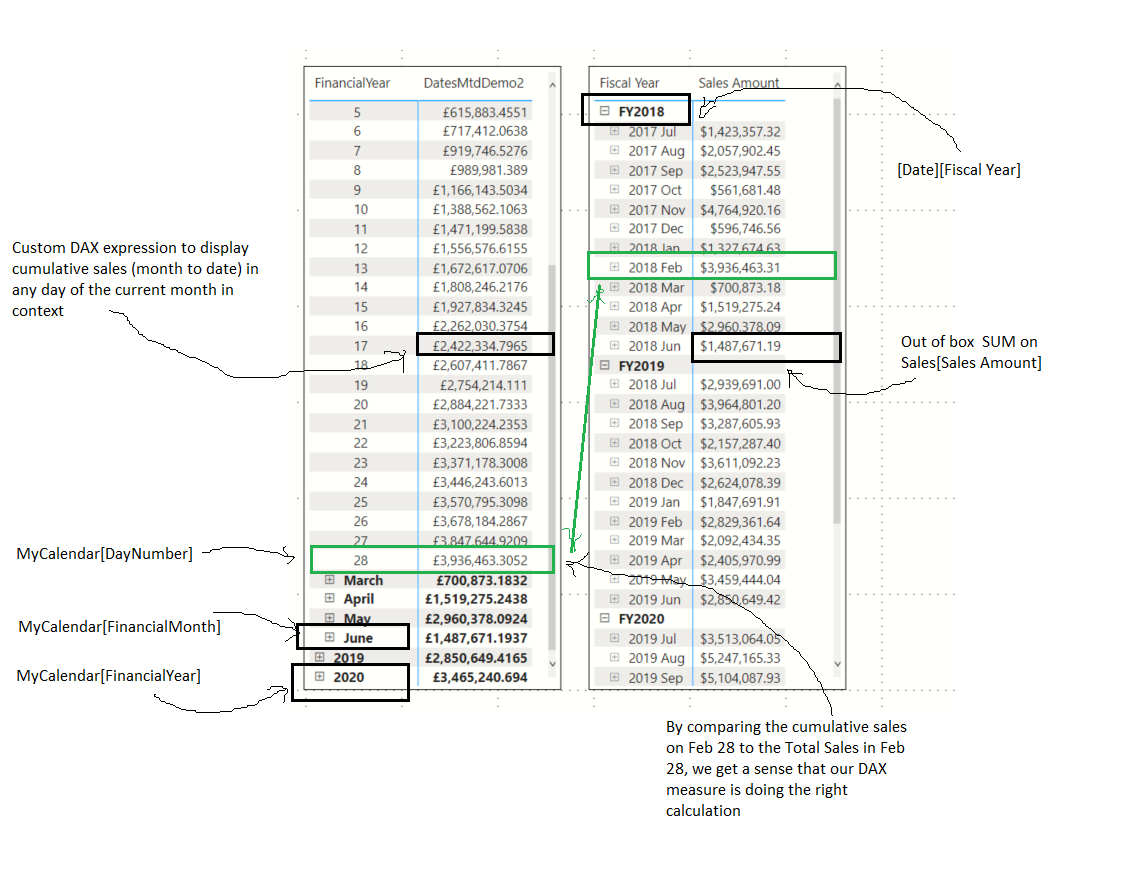
In the previou step we obtained the cumulative count of days in a month. We will use this informatin to FILTER the Sales. In the following DAX measure we use the DATESMTD to get all the date values from the start of month till current day in the month. The Date[Date] column is filtered using the cumulative list of days. The cumulative value of Sales[Sales Amount] is then calculated by using the list of days.
    DatesMtdDemo2 =
        VAR datesInThisMonth = DATESMTD(MyCalendar[Date])
        VAR filteredDates = FILTER('Date', 'Date'[Date] in datesInThisMonth)
        VAR totalSales  = CALCULATE
        (
            SUMX(Sales, Sales[Sales Amount]),
            filteredDates
        )
        return totalSales
In the following illustration we do a side by side comparison of the cumulative sales on the last day of the month on the left side and the total sales in that month on the right. Notice that the cumulative total on Feb 28 th (left side) is equal to the overall monthly total on Feb (right side).
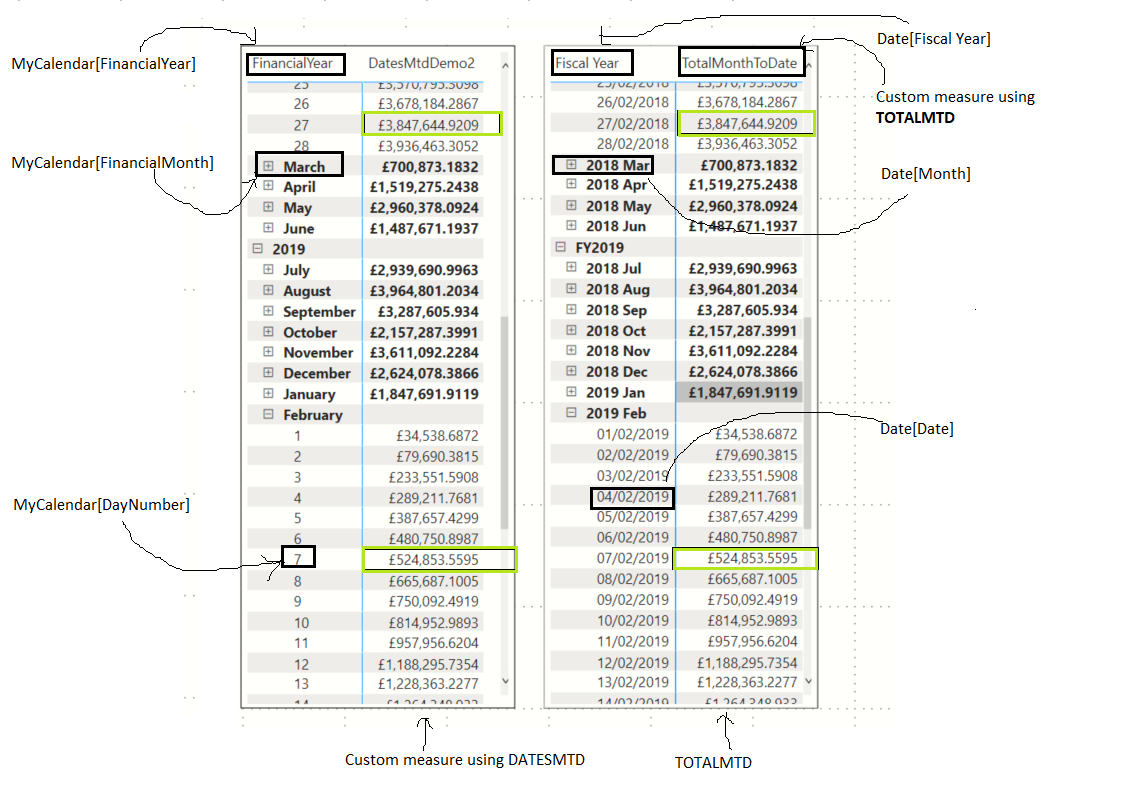
Our objective remains the same as stated in the previous section. But, there is a simpler way to achieve this objective.
The following DAX measure expects a current day of month in the current context.
TotalMonthToDate = TOTALMTD(SUMX(Sales, [Sales Amount]),'Date'[Date])
How can we be sure that TOTALMTD produces the same value as that obtained by the customer measure DatesMtdDemo2 that we wrote in the previous section?
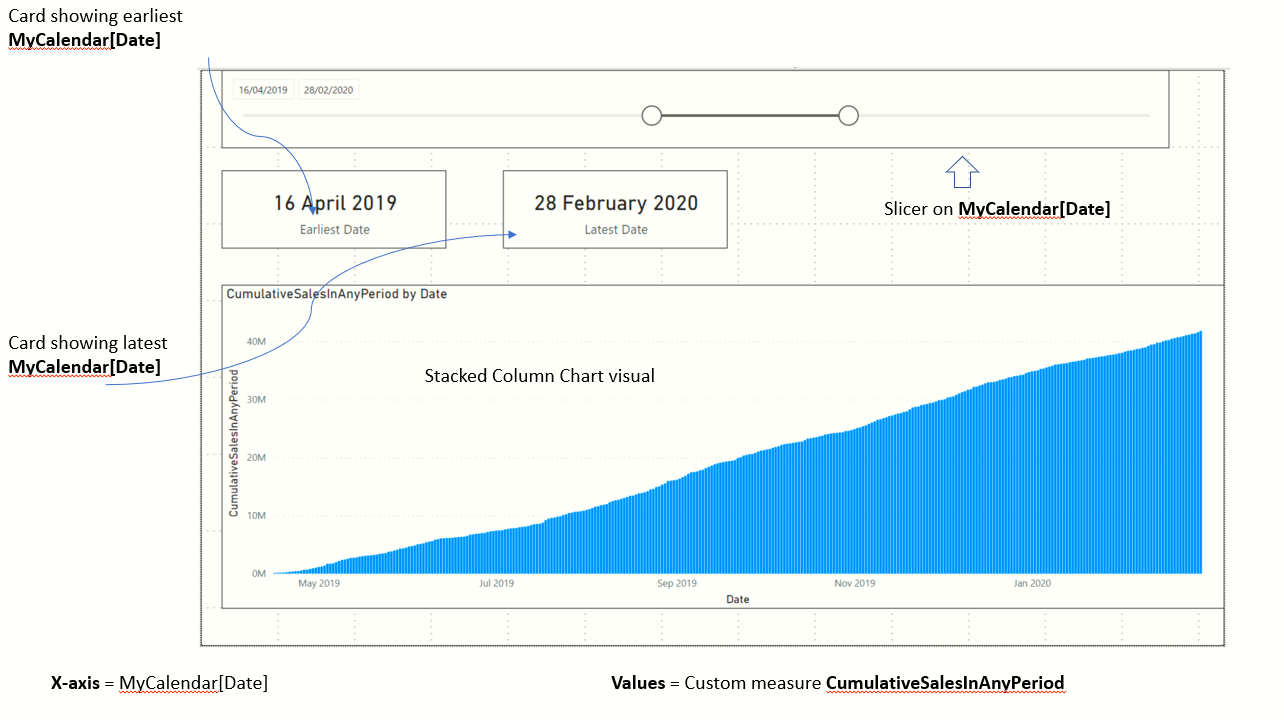
Let us do a side by side comparison
    CumulativeSalesInAnyPeriod =
    VAR currentDate = SELECTEDVALUE(MyCalendar[Date])

    VAR first = FIRSTDATE(ALLSELECTED(MyCalendar[Date]))
    VAR last = LASTDATE(ALLSELECTED(MyCalendar[Date]))


    VAR totalSales  = CALCULATE
    (
        SUMX(Sales, Sales[Sales Amount]),
        FILTER(
            Sales,
            RELATED('Date'[Date]) >= first && RELATED('Date'[Date]) <= currentDate
            )
    )
    return totalSales
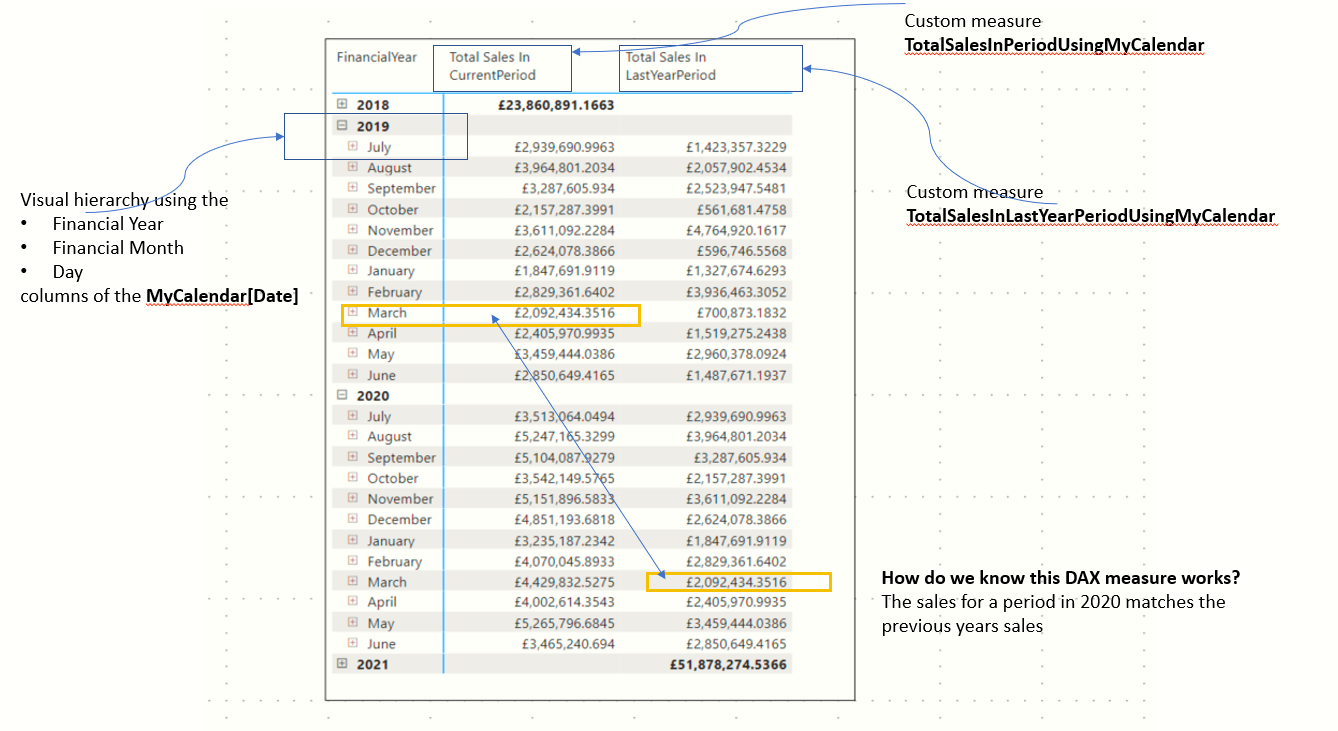
Consider a scenario where we want to compare the sales in a period in the year 2020 and the same period in the year 2019. The DATEADD function makes this possible.
    TotalSalesInLastYearPeriodUsingMyCalendar =
    VAR lastYearSamePeriod= DATEADD(MyCalendar[Date],-1 , YEAR)
    VAR firstDateInPeriod=  FIRSTDATE(lastYearSamePeriod)
    VAR lastDateInPeriod=  LASTDATE(lastYearSamePeriod)

    VAR totalSales  = CALCULATE
    (
        SUMX(Sales, Sales[Sales Amount]),
        FILTER(
            Sales,
            RELATED('Date'[Date]) >= firstDateInPeriod && RELATED('Date'[Date]) <= lastDateInPeriod
            )
    )
    return totalSales
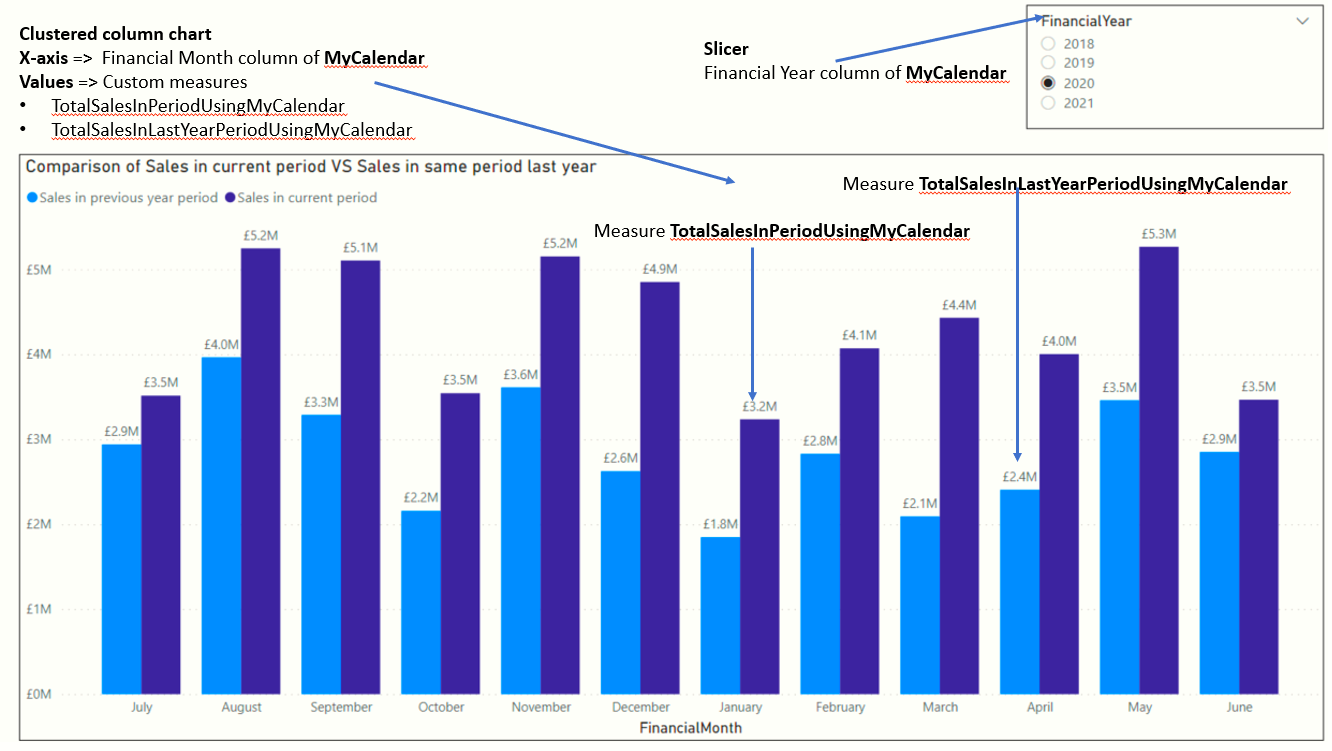
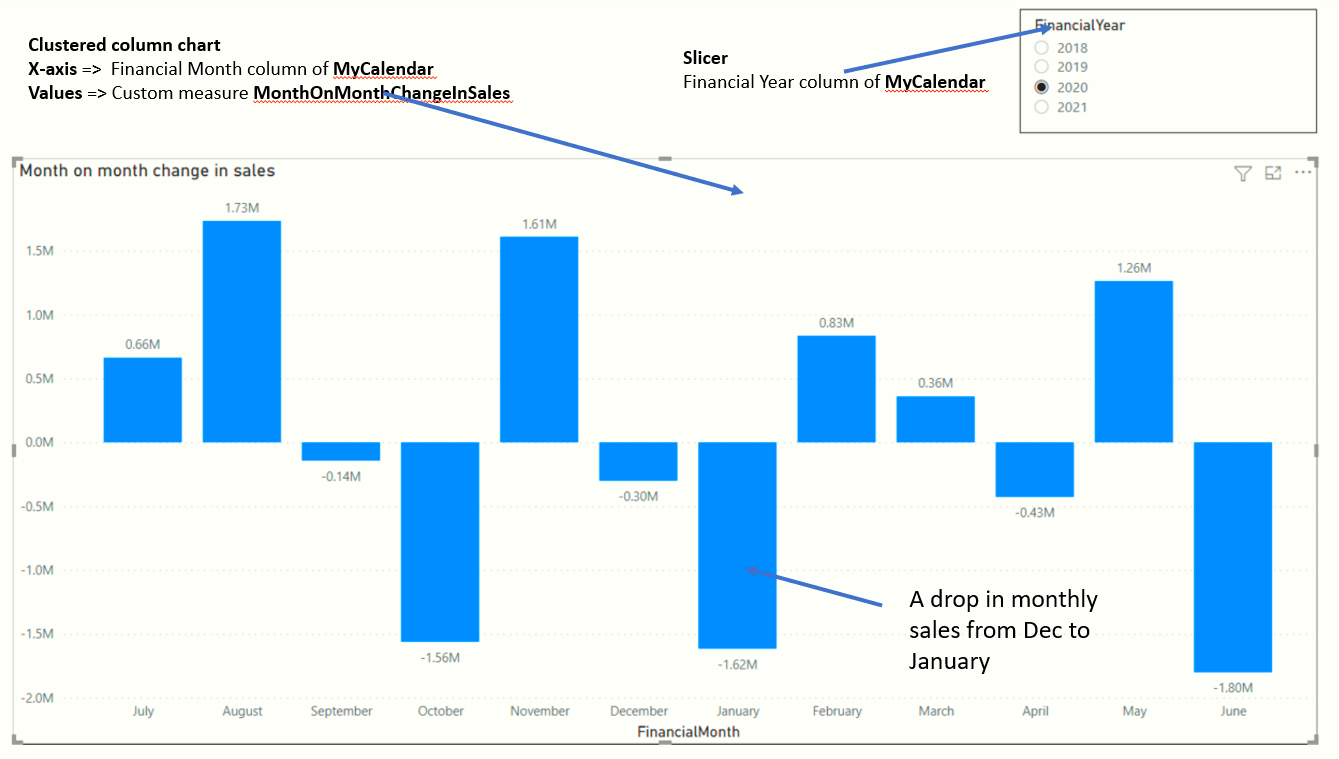
We want to compare the month on month growth/fall in sales. Given a selected year, we want to plot a histogram where for every month we want to see the difference in Sales in that month w.r.t previous month
    MonthOnMonthChangeInSales =
    VAR totalSalesInCurrentMonth = AdventureWorksMeasures[TotalSalesInPeriodUsingMyCalendar]

    //Calculate previous month sales
    VAR firstDateInCurrentContext = FIRSTDATE(MyCalendar[Date])
    VAR datesInPreviousMonth = PREVIOUSMONTH(firstDateInCurrentContext)

    VAR firstDateInPreviousMonth = FIRSTDATE(datesInPreviousMonth)
    VAR lastDateInPreviousMonth = LASTDATE(datesInPreviousMonth)
    VAR totalSalesInPreviousMonth  = CALCULATE
        (
            SUMX(Sales, Sales[Sales Amount]),
            FILTER(
                Sales,
                RELATED('Date'[Date]) >= firstDateInPreviousMonth && RELATED('Date'[Date]) <= lastDateInPreviousMonth
                )
        )
    return totalSalesInCurrentMonth-totalSalesInPreviousMonth
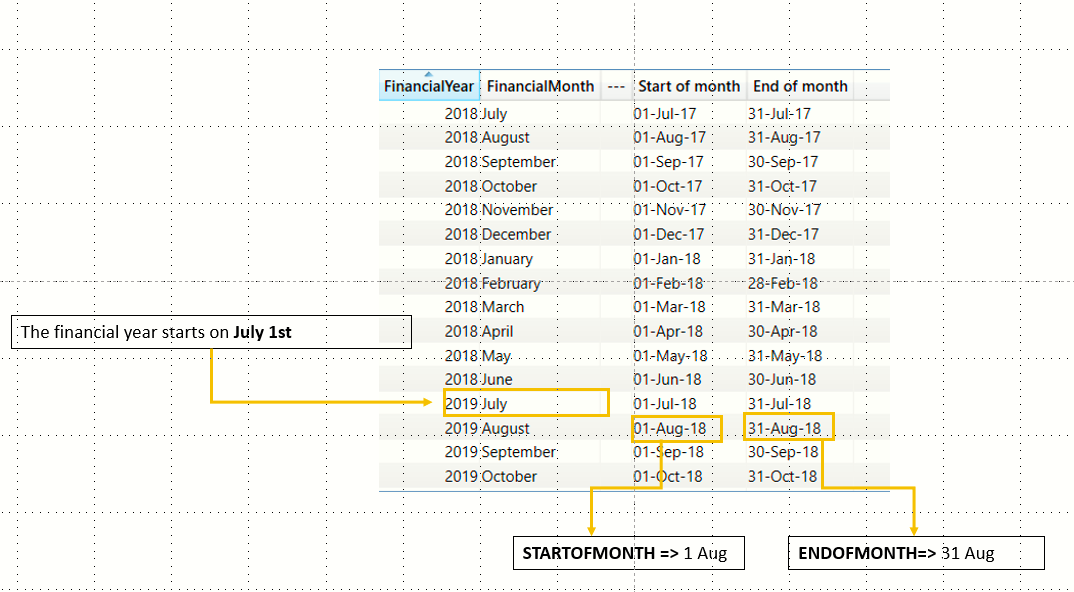
Microsoft's documentation for STARTOFMONTH and ENDOFMONTH can be found here and here. To understand how these functions work, lets us write out a DAX query on the MyCalendar table and display the outcome for each month.
EVALUATE
(
	SUMMARIZE
	(
		MyCalendar,
		MyCalendar[FinancialYear],
		MyCalendar[FinancialMonth],
		"---", "  ",
		"Start of month", FORMAT(STARTOFMONTH(MyCalendar[Date]), "Medium Date"),
		"End of month", FORMAT(ENDOFMONTH(MyCalendar[Date]), "Medium Date")
	)
)
We want to plot the daily sales as a percentage of total sales in that month for any specified time slice
    % of Monthly Sales =

    VAR firstDateInPeriod = FIRSTDATE(MyCalendar[Date])
    VAR lastDateInPeriod = LASTDATE(MyCalendar[Date])
    VAR monthStart=STARTOFMONTH(MyCalendar[Date])
    VAR monthEnd=ENDOFMONTH(MyCalendar[Date])

        VAR totalSalesInMonth  = CALCULATE
        (
            SUMX(Sales, Sales[Sales Amount]),
            FILTER(
                Sales,
                RELATED('Date'[Date]) >= monthStart && RELATED('Date'[Date]) <= monthEnd
                )
        )
        VAR totalSalesToday=CALCULATE
        (
            SUMX(Sales, Sales[Sales Amount]),
            FILTER(
                Sales,
                RELATED('Date'[Date]) >= firstDateInPeriod && RELATED('Date'[Date]) <= lastDateInPeriod
                )
        )
        VAR percentage= (totalSalesToday/totalSalesInMonth)*100
        return ROUND(percentage,2)
Microsoft documentation for NEXTDAY and PREVIOUSDAY can be found here and here. This is best understood via the following query written in DAX Studio. In this query we are summarizing first by Year, followed by Month and then displaying the result of PREVIOUSDAY/NEXTDAY.
    DEFINE TABLE newCalendr = ADDCOLUMNS(
                CALENDAR(DATE(2017,7,1),DATE(2021,6,30)),
                "Year", YEAR([Date]),
                "MonthNumber", MONTH([Date]),
                "DayNumber", DAY([Date]),
                "Month", FORMAT([Date],"mmmm"),
                "DayOfWeek", FORMAT([Date],"ddd"),
                "DayOfWeekNumber", WEEKDAY([Date]),
                "QuarterNumber", QUARTER([Date]),
                "Quarter", FORMAT([Date],"\QQ"),
                "WeekNumber",WEEKNUM([Date])
                )

    EVALUATE
    (
	    SUMMARIZE
	    (
		    newCalendr,
		    newCalendr[Year],
		    newCalendr[MonthNumber],
		    "CountOfDays", COUNT(newCalendr[Date]),
		    "First", FORMAT(FIRSTDATE(newCalendr[Date]), "Medium Date"),
		    "Previous", FORMAT(PREVIOUSDAY(newCalendr[Date]), "Medium Date"),
		    "Next", 	FORMAT(NEXTDAY    (newCalendr[Date]), "Medium Date")
	    )
    )
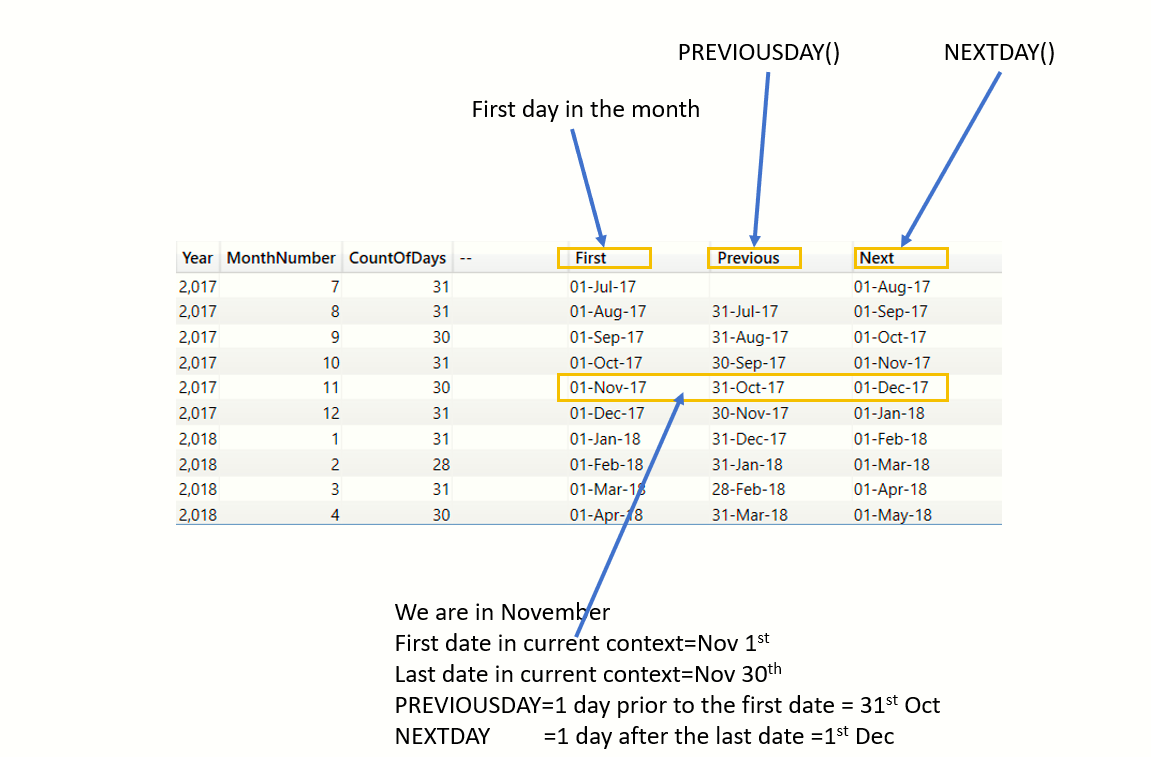
I observed a slight difference in behaviour of the NEXTDAY function as per Microsof's documentation here.
As of writing this article, MS documentation says
Returns a table that contains a column of all dates from the next day, based on the first date specified in the dates column in the current context.
In my opinion, it should be
...based on the last date specified in the dates column in the current context.
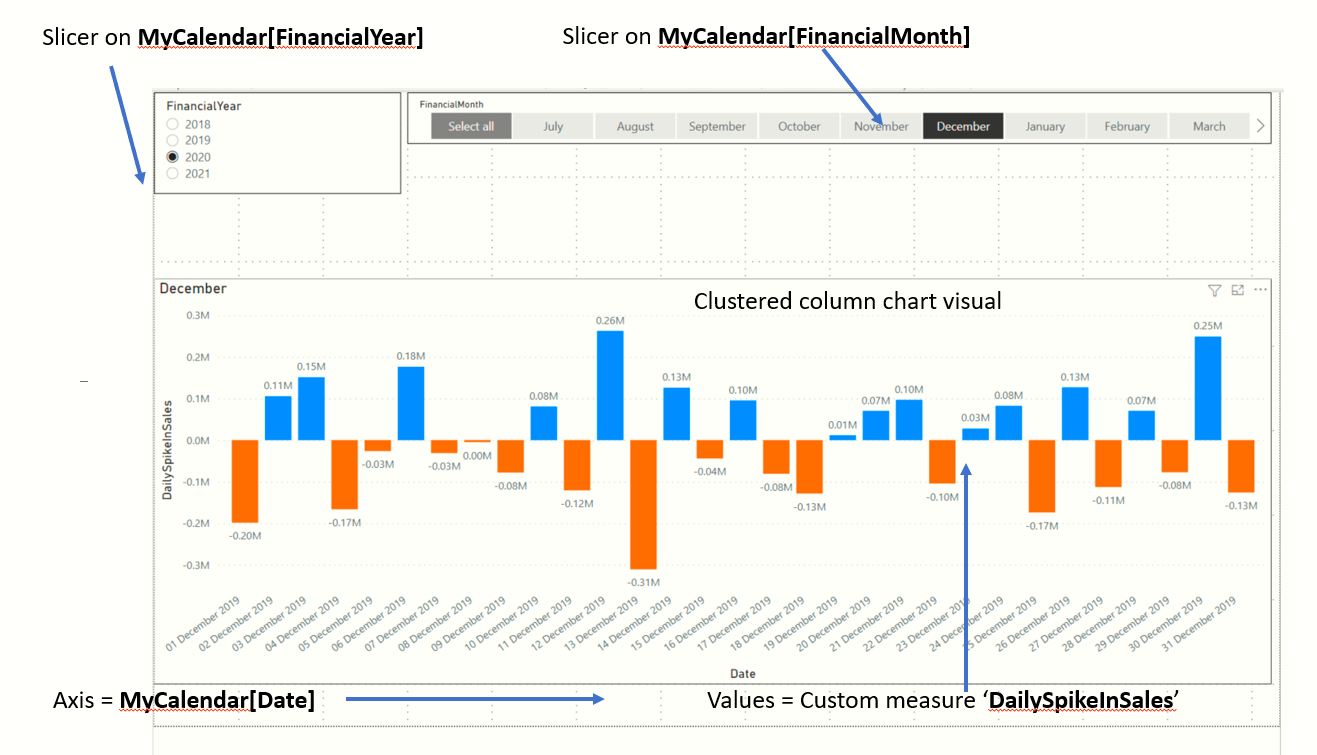
Given any slice of time (e.g a Month) plot the daily change in Sales. Example: If this were plotted on a column chart, then the bar for June 5th should indicate the difference between the sales on June 5th and June 4th.
    DailySpikeInSales =
    var firstDateInSelectedDates = FIRSTDATE(MyCalendar[Date])
    VAR yesterday = PREVIOUSDAY(firstDateInSelectedDates)
    VAR totalSalesToday = AdventureWorksMeasures[TotalSalesInPeriodUsingMyCalendar]

    VAR totalSalesYesterday  = CALCULATE
        (
            SUMX(Sales, Sales[Sales Amount]),
            FILTER(
                Sales,
                RELATED('Date'[Date]) >= yesterday && RELATED('Date'[Date]) <= yesterday
                )
        )


    return totalSalesToday - totalSalesYesterday
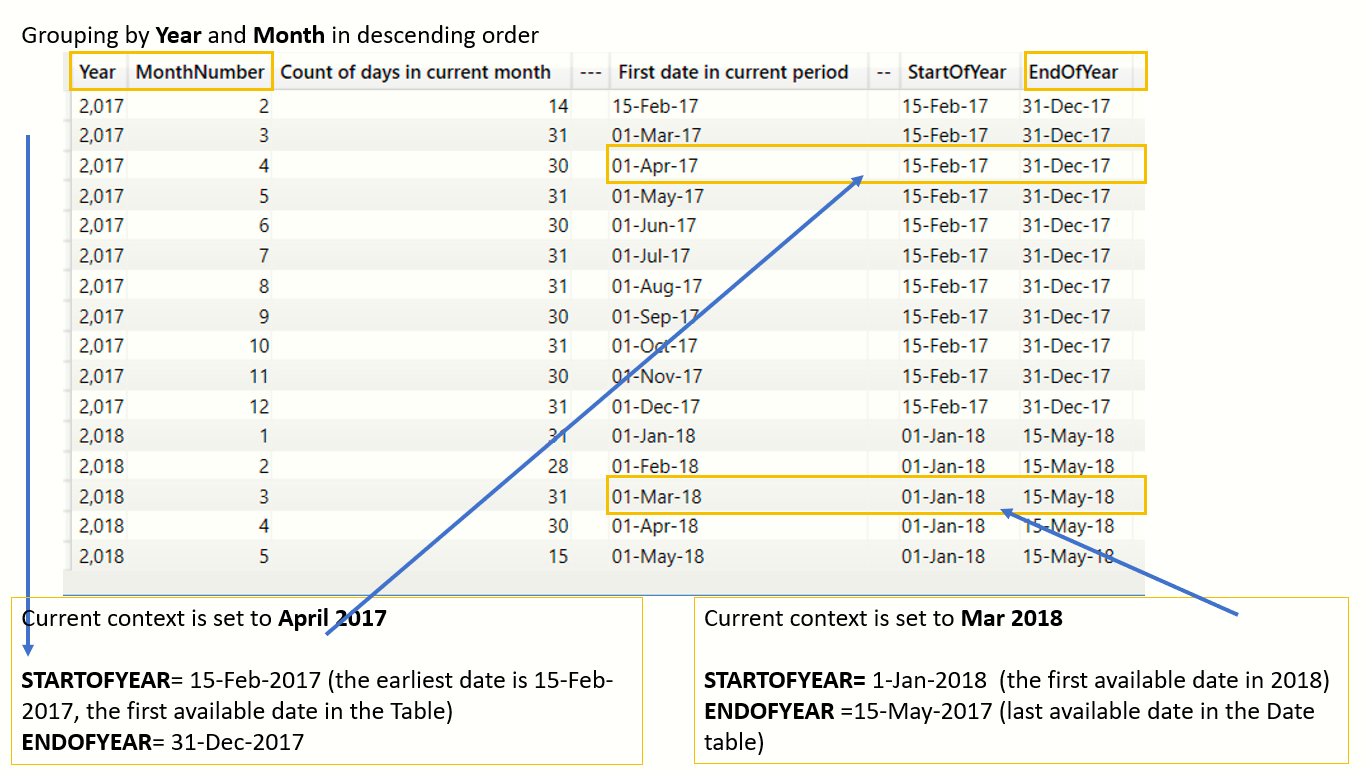
Microsoft documentation for STARTOFYEAR and ENDOFYEAR can be found here and here. This is best understood via the following queries written in DAX Studio. Both STARTOFYEAR and ENDOFYEAR have a second parameter which defaults to 31st December. This is the financial year end.
We examine the behaviour when we do not specify any default year end (i.e. 31st December)
    DEFINE TABLE newCalendr = ADDCOLUMNS(
            CALENDAR(DATE(2017,2,15),DATE(2018,5,15)),
            "Year", YEAR([Date]),
            "MonthNumber", MONTH([Date]),
            "DayNumber", DAY([Date]),
            "Month", FORMAT([Date],"mmmm")
            )


    EVALUATE
    (
	    SUMMARIZE
	    (
		    newCalendr,
		    newCalendr[Year],
		    newCalendr[MonthNumber],
		    "Count of days in current month", COUNT(newCalendr[Date]),
		    "---", "  ",
		    "First date in current period", FORMAT(FIRSTDATE(newCalendr[Date]), "Medium Date"),
		    "--", "  ",
		    "StartOfYear", FORMAT( STARTOFYEAR(newCalendr[Date]), "Medium Date"),
		    "EndOfYear", 	FORMAT(ENDOFYEAR(newCalendr[Date]), "Medium Date")
	    )
    )
    DEFINE TABLE newCalendr = ADDCOLUMNS(
            CALENDAR(DATE(2017,2,15),DATE(2018,5,15)),
            "Year", YEAR([Date]),
            "MonthNumber", MONTH([Date]),
            "DayNumber", DAY([Date]),
            "Month", FORMAT([Date],"mmmm")
            )

    EVALUATE
    (
	    SUMMARIZE
	    (
		    newCalendr,
		    newCalendr[Year],
		    newCalendr[MonthNumber],
		    "Count of days in current month", COUNT(newCalendr[Date]),
		    "---", "  ",
		    "First date in current period", FORMAT(FIRSTDATE(newCalendr[Date]), "Medium Date"),
		    "--", "  ",
		    "StartOfYear", FORMAT( STARTOFYEAR(newCalendr[Date],"0000-3-15"), "Medium Date"),
		    "EndOfYear", 	FORMAT(ENDOFYEAR(newCalendr[Date],"0000-3-15" ), "Medium Date")
	    )
    )
We are now specifying a custom year end (15th March). The 'year end' defines the end of the fiscal year. How does the behaviour change?
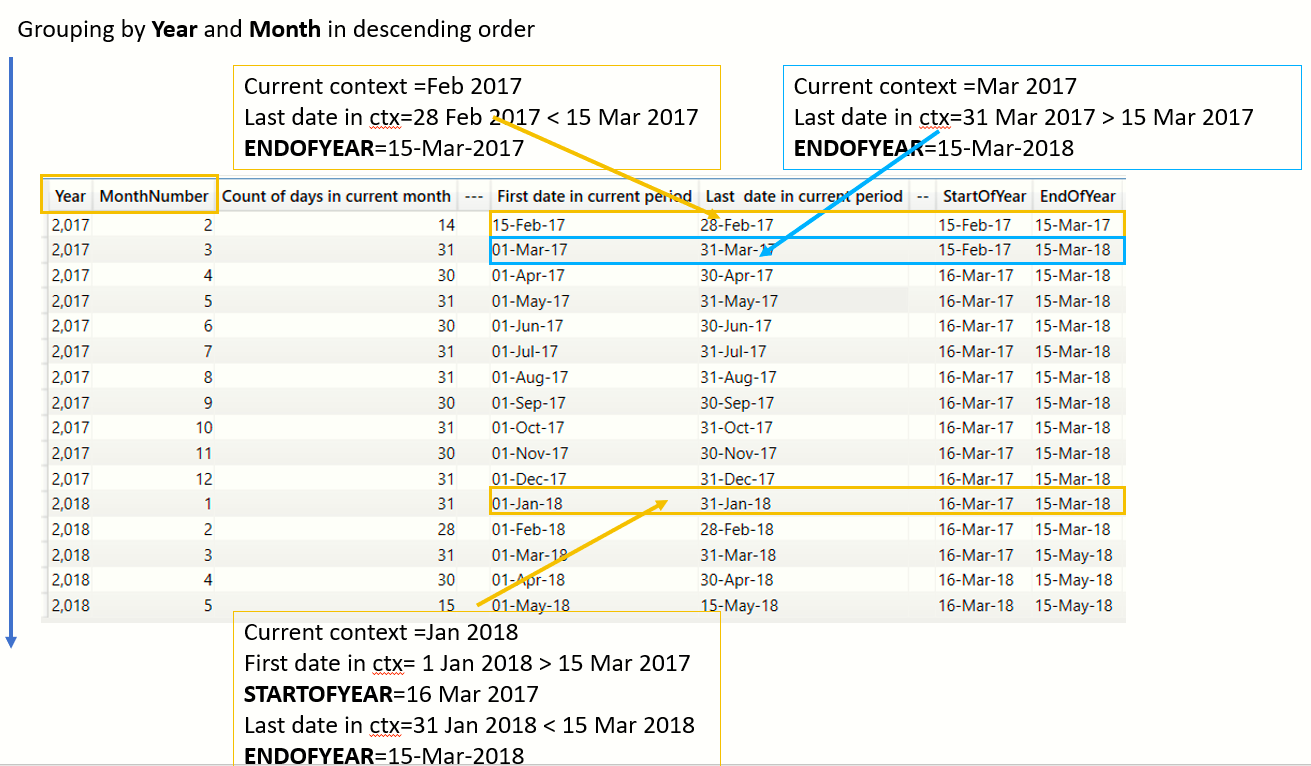
The DAX expressions presented above demonstrate the susceptibility of STARTOFYEAR and ENDOFYEAR formulas to the 'year end' parameter. If there is a need for a custom year end for compliance with financial accounting standards, then any calculation involving STARTOFYEAR and ENDOFYEAR must have the 'year end' parameter. This makes me feel that it is safer to define the financial period through a custom date table, as in the example MyCalendar[FinancialYear] and also in the Date[Fiscal Year] table of Adventure Works
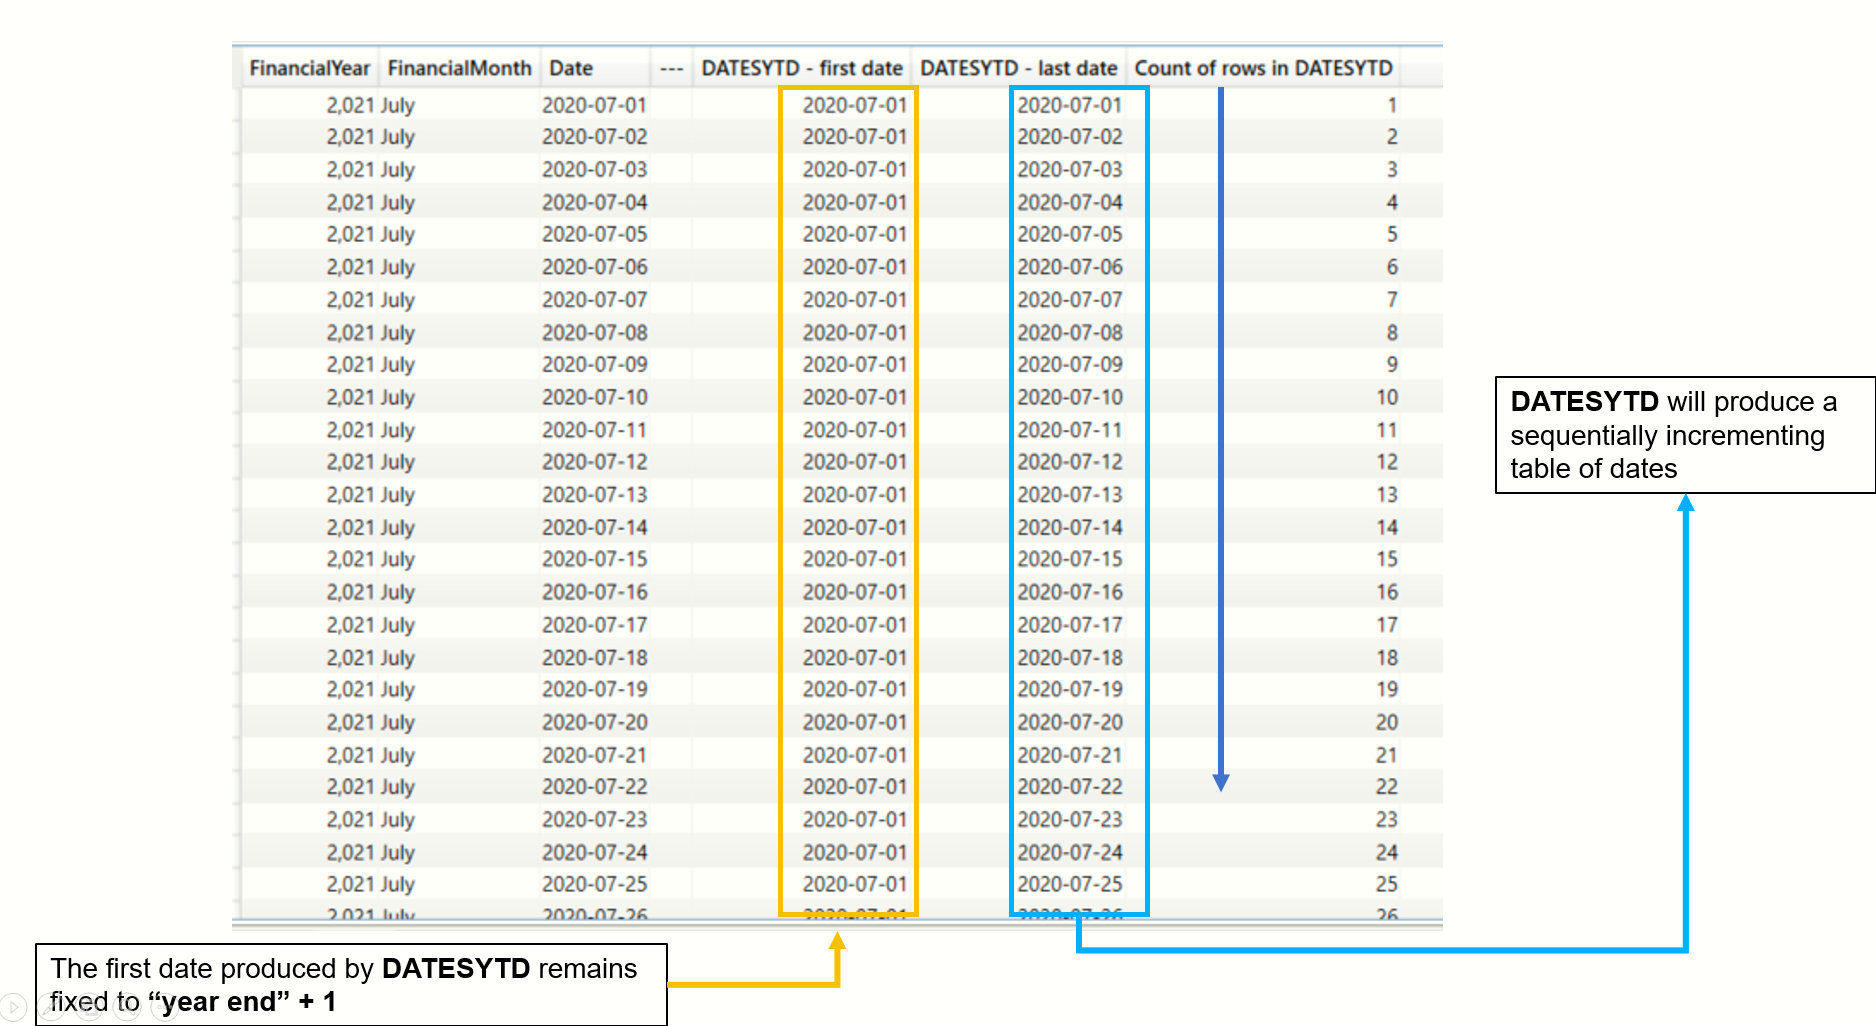
The function DATESYTD works in a similar fashion to DATESMTD. The function produces a table of dates with dates starting from the first day of the year till the current date in the context. The behaviour of this function is sensitive to the "year_end_date" parameter. By default this is set to 31st December. When is DATESYTD useful? Consider a scenario where you want to display the cumulative sales from the start of the year right up to current date. (Refer the section on DATESMTD). Let us write out the following DAX query to better understand the behaviour of this function.
        EVALUATE
        (
	        SUMMARIZE
	        (
		        MyCalendar,
		        MyCalendar[FinancialYear],
		        MyCalendar[FinancialMonth],
		        MyCalendar[Date],
		        "---", "  ",
		        "DATESYTD - first date",  	FIRSTDATE(DATESYTD(MyCalendar[Date],"0000-06-30")),
		        "DATESYTD - last date",  	LASTDATE(DATESYTD(MyCalendar[Date],"0000-06-30")),
		        "Count of rows in DATESYTD", COUNTROWS(DATESYTD(MyCalendar[Date],"0000-06-30"))

	        )
        )
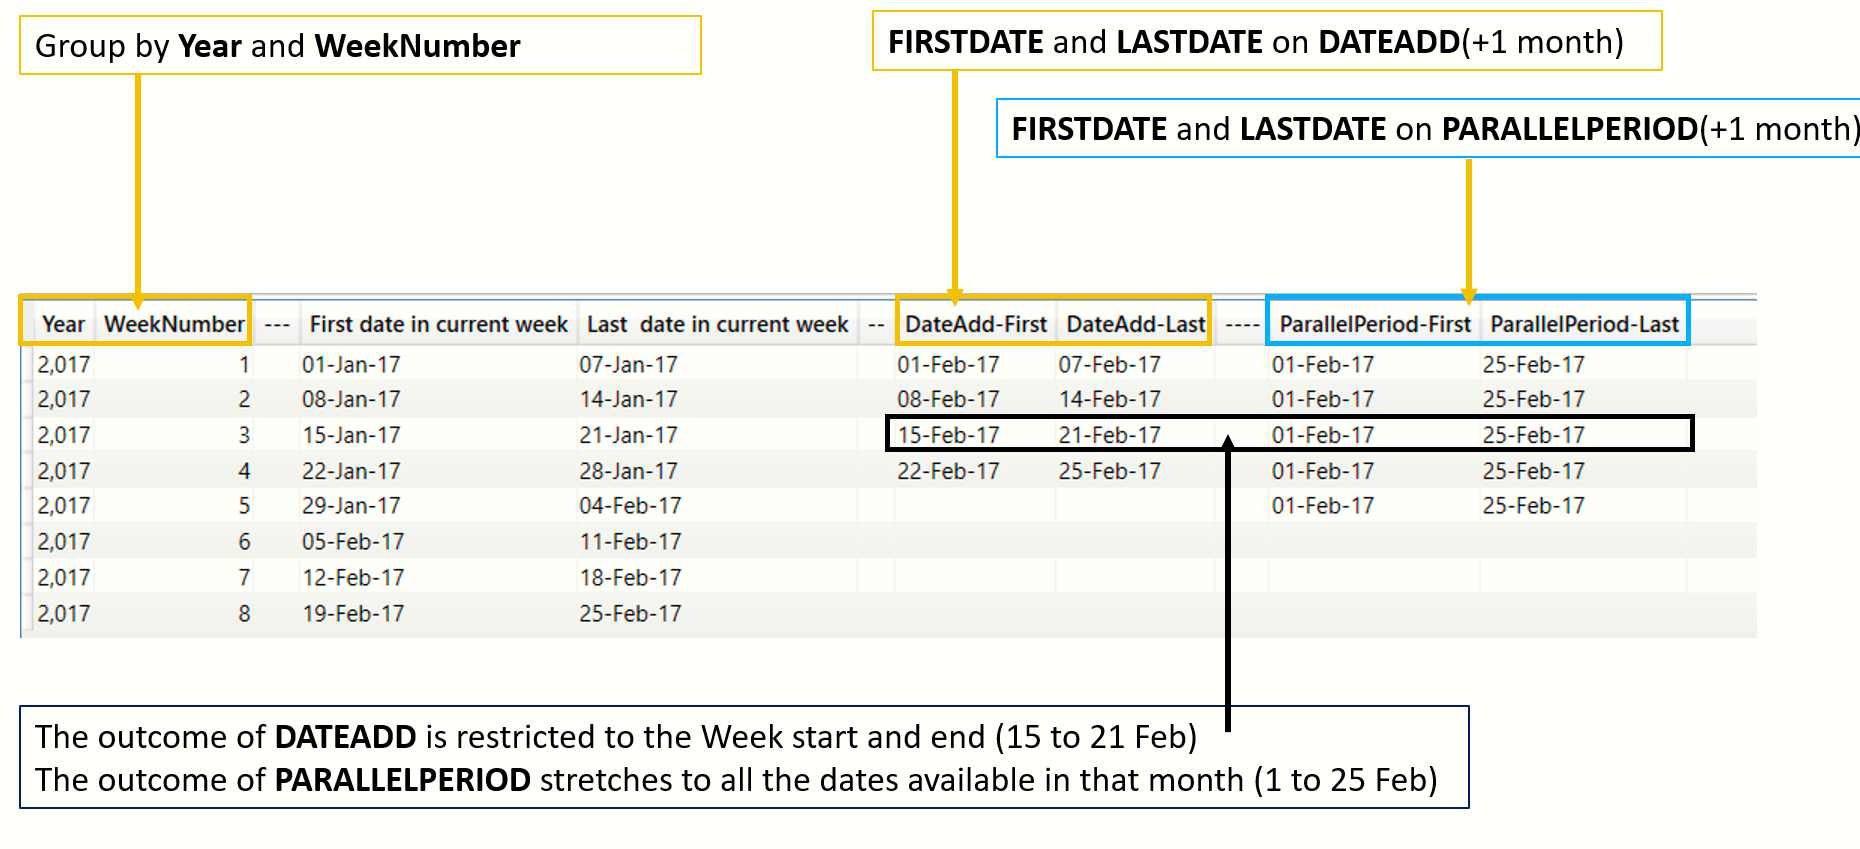
The functions PARALLELPERIOD and DATEADD appear to be deceptively similar. However, there are important differences. Microsoft documentation for PARALLELPERIOD and DATEADD can be found here and here respectively. Notice the fine print in the documentation of PARALLELPERIOD:
The PARALLELPERIOD function is similar to the DATEADD function except that PARALLELPERIOD always returns full periods at the given granularity level instead of the partial periods that DATEADD returns. For example, if you have a selection of dates that starts at June 10 and finishes at June 21 of the same year, and you want to shift that selection forward by one month then the PARALLELPERIOD function will return all dates from the next month (July 1 to July 31); however, if DATEADD is used instead, then the result will include only dates from July 10 to July 21Let us write some custom DAX queries to understand the differences. In the following DAX, we create a CALENDAR table with just the months of Jan and Feb (upto 25th) in the year 2017. We summarize the results by the WEEKNUM and display the outcome of FIRSTDATE/LASTDATE on PARALLELPERIOD and DATEADD. We are incrementing PARALLELPERIOD/DATEADD by a 1 month interval.
    DEFINE TABLE newCalendr = ADDCOLUMNS(
                CALENDAR(DATE(2017,1,1),DATE(2017,2,25)),
                "Year", YEAR([Date]),
                "MonthNumber", MONTH([Date]),
                "Month", FORMAT([Date],"mmmm"),
                "DayNumber", DAY([Date]),
                "WeekNumber",WEEKNUM([Date])
                )


    VAR interval=1

    EVALUATE
    (
	    SUMMARIZE
	    (
		    newCalendr,
		    newCalendr[Year],
		    newCalendr[WeekNumber],
		    "Count of days in current month", COUNT(newCalendr[Date]),
		    "---", "  ",
		    "First date in current period", FORMAT(FIRSTDATE(newCalendr[Date]), "Medium Date"),
		    "Last  date in current period", FORMAT(LASTDATE(newCalendr[Date]), "Medium Date"),
		    "--", "  ",
		    "DateAdd-First", FORMAT(FIRSTDATE(DATEADD(newCalendr[Date],interval,month)),"Medium Date"),
		    "DateAdd-Last", FORMAT(LASTDATE(DATEADD(newCalendr[Date],interval,month)),"Medium Date"),
		    "----", "  ",
		    "ParallelPeriod-Start", FORMAT(FIRSTDATE(PARALLELPERIOD(newCalendr[Date],interval,month)),"Medium Date"),
		    "ParallelPeriod-End", 	FORMAT(LASTDATE(PARALLELPERIOD(newCalendr[Date],interval,month)),"Medium Date")

	    )
    )
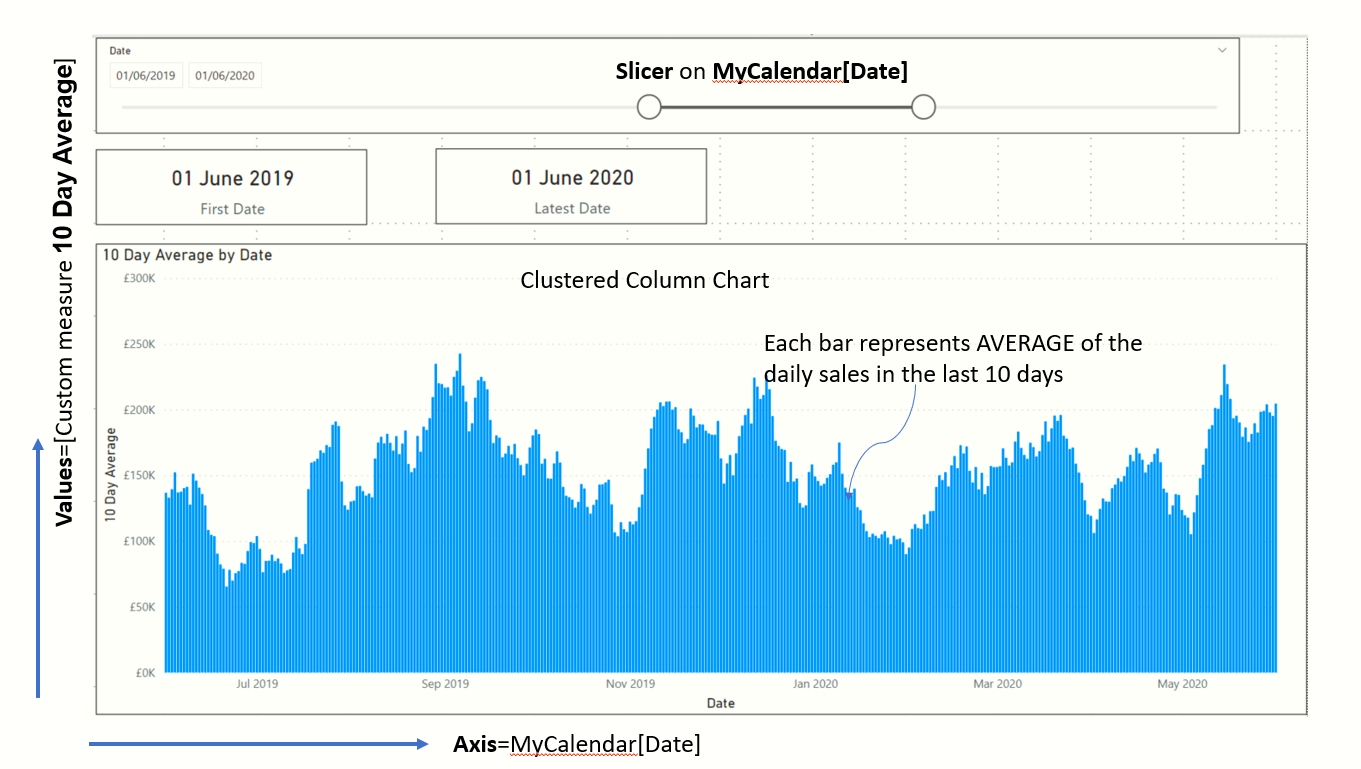
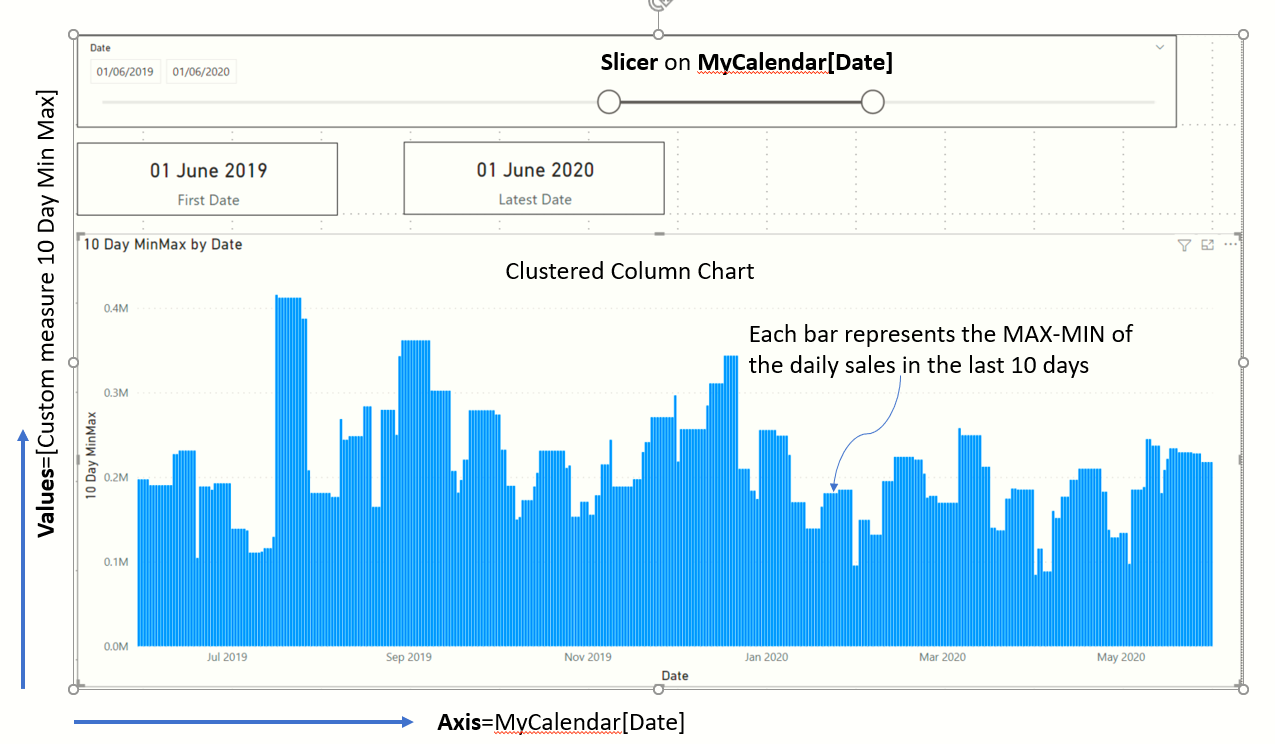
We want to do a moving window anaylsis within a specified period of time. For every day within this period, look back N days and compute some statistic over this N day time frame. The statistic could be the average daily sales - commonly known as the "moving average" or "rolling mean". Likewise, we could also compute the "moving range", i.e. the difference between the highest and lowest daily sales over the N day time frame.
        10 Day MinMax =
        var slidingWindow=-10
        VAR currentDate = FIRSTDATE(MyCalendar[Date])
        var tenDaysAgo = DATEADD(currentDate,slidingWindow, DAY)

        VAR salesInSlidingWindow=FILTER(
                        Sales,
                        RELATED('Date'[Date]) >= tenDaysAgo && RELATED('Date'[Date]) <= currentDate
                        )
        //We want the daily sales, hence group by date
        VAR summaryOfDailySales = SUMMARIZE(
                        salesInSlidingWindow, [OrderDateKey],
                        "TotalDailySales", SUMX(Sales, Sales[Sales Amount]))


        VAR maxSalesInSlidingWindow = MAXX(summaryOfDailySales, [TotalDailySales])
        VAR minSalesInSlidingWindow = MINX(summaryOfDailySales, [TotalDailySales])
        return maxSalesInSlidingWindow - minSalesInSlidingWindow
Taking inspiration from the '10 day moving range' , we will attempt to do a '10 day moving average'. The principles are identical
    10 Day Average =
    var slidingWindow=-10
    VAR currentDate = FIRSTDATE(MyCalendar[Date])
    var tenDaysAgo = DATEADD(currentDate,slidingWindow, DAY)

    VAR totalSalesInSlidingWindow  = CALCULATE
    (
        SUMX(Sales, Sales[Sales Amount]),
        FILTER(
            Sales,
            RELATED('Date'[Date]) >= tenDaysAgo && RELATED('Date'[Date]) <= currentDate
            )
    )

    VAR averageSalesInSlidingWindow = ABS(totalSalesInSlidingWindow/slidingWindow)
    return averageSalesInSlidingWindow